fids <- read_csv(here("_posts","2021-08-20-bringing-it-all-together", "HTL-MAR-FiddlerCrabBodySize_copy.csv"))
Data Exploration
ggplot(fids, aes(x = Latitude, y = carapace_width)) +
  geom_point(aes(color = Latitude)) +
  labs(title = "Carapace Width by Latitude",
       x = "Latitude",
       y = "Carapace Width (mm)",
       caption = "Figure A is the observed Caprapace widths at latitude degrees") +
  theme_classic()
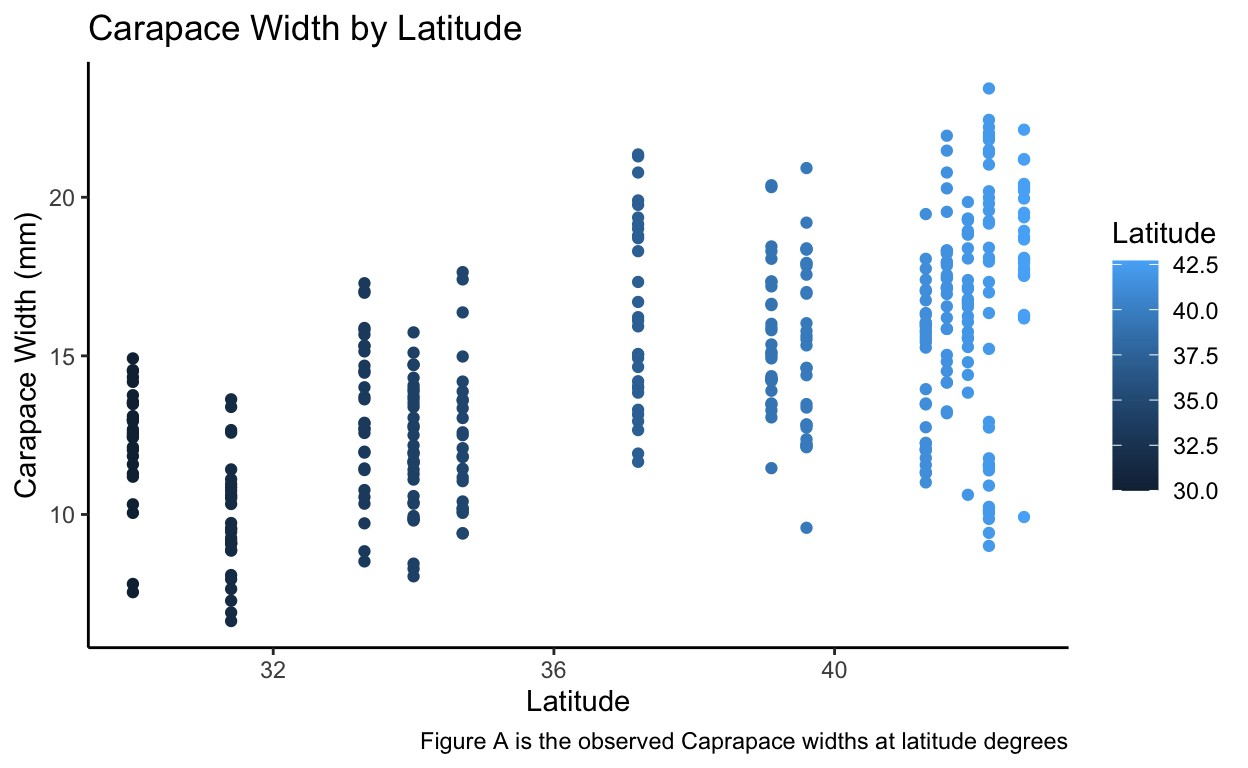
Here we have a nice figure in which we can do some initial data exploration regarding carapace width by latitude.
Data Table
data <- fids %>%
  clean_names() %>%
  group_by(site) %>%
  summarize(mean_carapace_width = round(mean(carapace_width), 2), sd_carapace_width = round(sd(carapace_width), 2), sample_size = n())

kable(data, col.name = c("Site", "Mean Carapace Width (mm)", "SD Carapace Width (mm)", "Sample Size")) %>%
  kable_classic()
| Site | Mean Carapace Width (mm) | SD Carapace Width (mm) | Sample Size |
|---|---|---|---|
| BC | 16.20 | 4.81 | 37 |
| CC | 16.82 | 2.05 | 27 |
| CT | 14.69 | 2.36 | 33 |
| DB | 15.60 | 2.12 | 30 |
| GTM | 12.40 | 1.80 | 28 |
| JC | 15.27 | 2.72 | 30 |
| NB | 17.14 | 2.29 | 29 |
| NIB | 13.29 | 2.42 | 30 |
| PIE | 18.50 | 2.30 | 28 |
| RC | 12.49 | 2.34 | 25 |
| SI | 9.85 | 1.79 | 30 |
| VCR | 16.34 | 2.94 | 30 |
| ZI | 12.06 | 2.01 | 35 |
Here is a data table with some basic info about our fiddler crabs at different sites
Temperature vs Carapace Width
mean_data = fids %>%
  clean_names() %>%
  group_by(matw) %>%
  summarize(mean_carapace_width = mean(carapace_width))

ggplot(mean_data, aes(x = matw, y = mean_carapace_width)) +
  geom_point() +
  labs(title = "Mean Carapace Width by Temp",
       x = "Mean Annual Water Temperature",
       y = "Mean Carapace Width (mm)",
       caption = "Figure B shows a negative trend in mean carapace width with increase in water temperature.") +
  theme_classic() +
  geom_smooth(method = "lm")

Here we can see the possible correlation between mean carapace width and temperature
Citations
Johnson, D. 2019. Fiddler crab body size in salt marshes from Florida to Massachusetts, USA at PIE and VCR LTER and NOAA NERR sites during summer 2016. ver 1. Environmental Data Initiative. https://doi.org/10.6073/pasta/4c27d2e778d3325d3830a5142e3839bb (Accessed 2021-08-20).
Wickham et al., (2019). Welcome to the tidyverse. Journal of Open Source Software, 4(43), 1686, https://doi.org/10.21105/joss.01686
Kirill Müller (2020). here: A Simpler Way to Find Your Files. R package version 1.0.1. https://CRAN.R-project.org/package=here
Garrett Grolemund, Hadley Wickham (2011). Dates and Times Made Easy with lubridate. Journal of Statistical Software, 40(3), 1-25. URL https://www.jstatsoft.org/v40/i03/.
Sam Firke (2021). janitor: Simple Tools for Examining and Cleaning Dirty Data. R package version 2.1.0. https://CRAN.R-project.org/package=janitor
Hao Zhu (2021). kableExtra: Construct Complex Table with ‘kable’ and Pipe Syntax. R package version 1.3.4. https://CRAN.R-project.org/package=kableExtra
```{.r .distill-force-highlighting-css}