Interesting Data Science Projects and Tools
Join Statements Tutorial
This tutorial demonstrates how to join data sets together with various join statements.
dbplyr Package Tutorial
This tutorial demonstrates the use of the dbplyr package for querying of PostgreSQL databases.
How to Connect to a Database
This tutorial was created in hopes to assist my co-workers in connecting to the RIBBiTR PostgreSQL Database I have built.
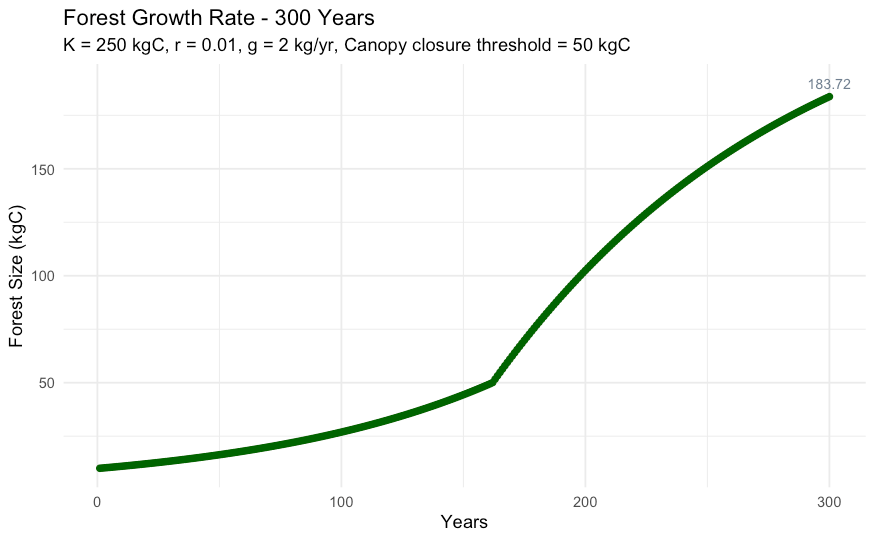
Growth Model & Sobol Sensitivity Analysis
This environmental model was completed as an assignment for the course, Environmental Data Science 230 | Environmental Science & Management: Modeling Environmental Systems. The goal of this assignment was to code a function to compute forest growth and conduct a sobol sensitivity analysis that explores how the estimated maximum and mean forest size varies. This assignment focuses on developing skills to create a model of forest growth and conduct a sobol sensitivity analysis.

CDIP Buoy Forecast
I am developing CDIP swell model forecasts to be implemented on a website. This is a work in progress.
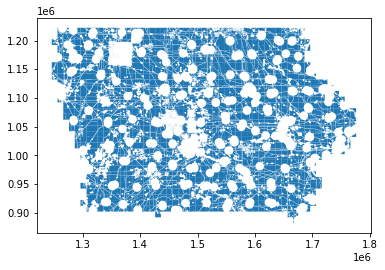
Iowa Wind Power
We were tasked with determining the amount of suitable land, total number of wind turbines, and Giga watts per hour the state of Iowa could install and produce based on government restrictions of wind turbines.
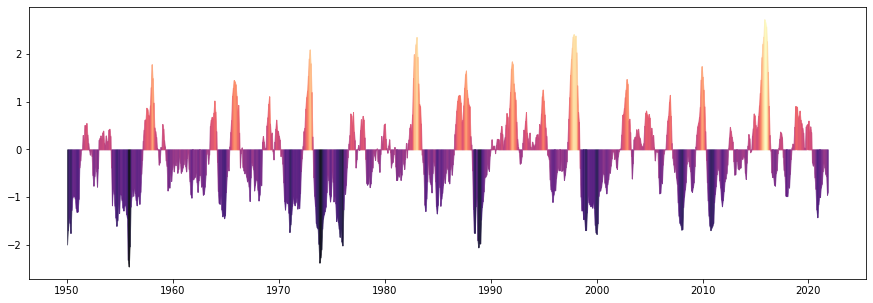
Modeling Enso and Wave Height
We are interested in investigating the effect of El Niño on our local oceanographic conditions. We used linear regression models to plot and compare equatorial sea surface temperature anomalies with local Santa Barbara temperature and wave height. Typically temperature anamolies are calcuated from a 30 year base period. Since we only had ~20 years of consistent data, we calculated monthly means since 1997 and used these as base values from which to compare monthly means for each year.
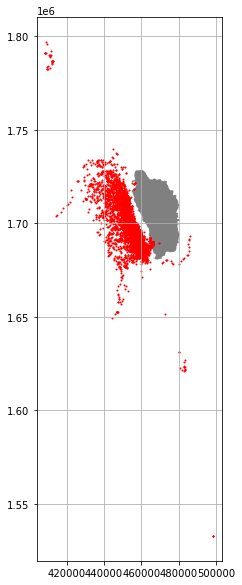
Protecting Whales
The goal of this project was to determine the postive and negative impacts of creating a speed reduction zone off the coast of Dominca through the use of sperm whale sigthing data and AIS vessel data.
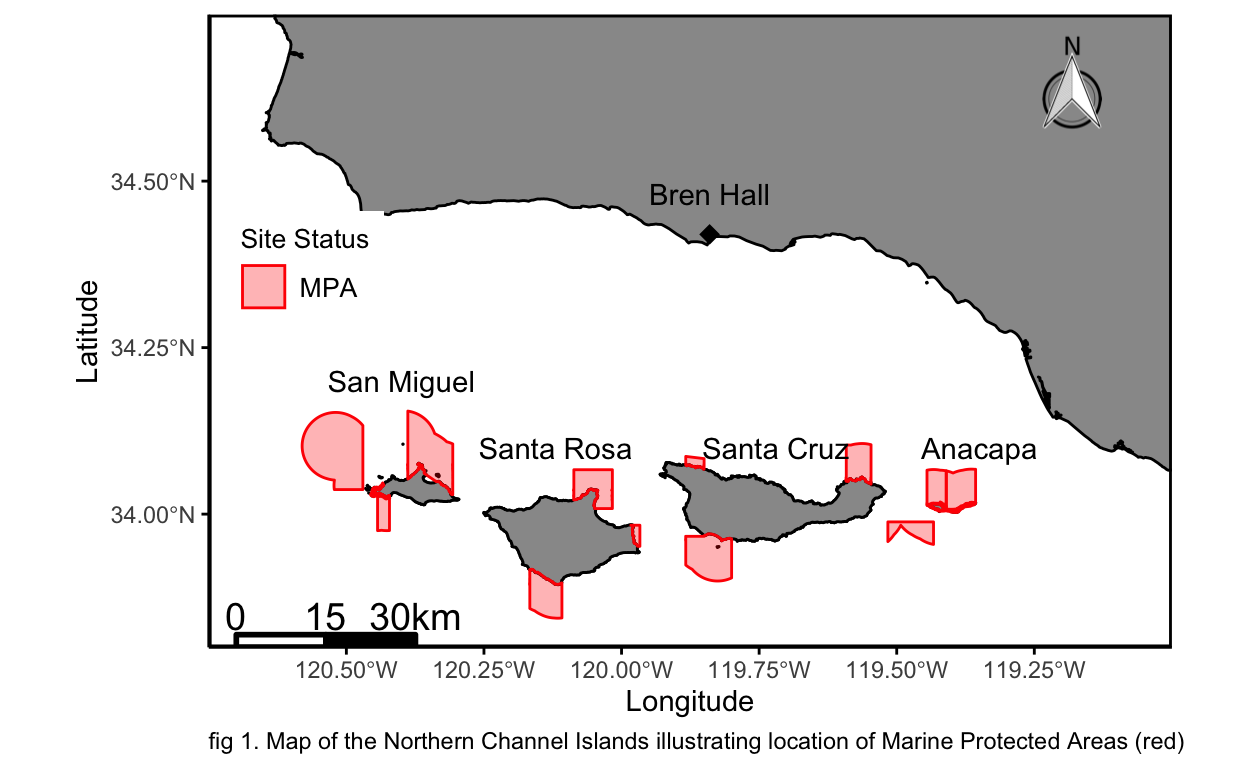
Do MPAs Increase Kelp Densities?
I analyzed 20 years of long-term kelp forest data collected by the Partnership for Interdisciplinary Studies of Coastal Oceans at the Northern Channel Islands in hopes of determining the drivers of kelp abundance.
Houston Ice Storm
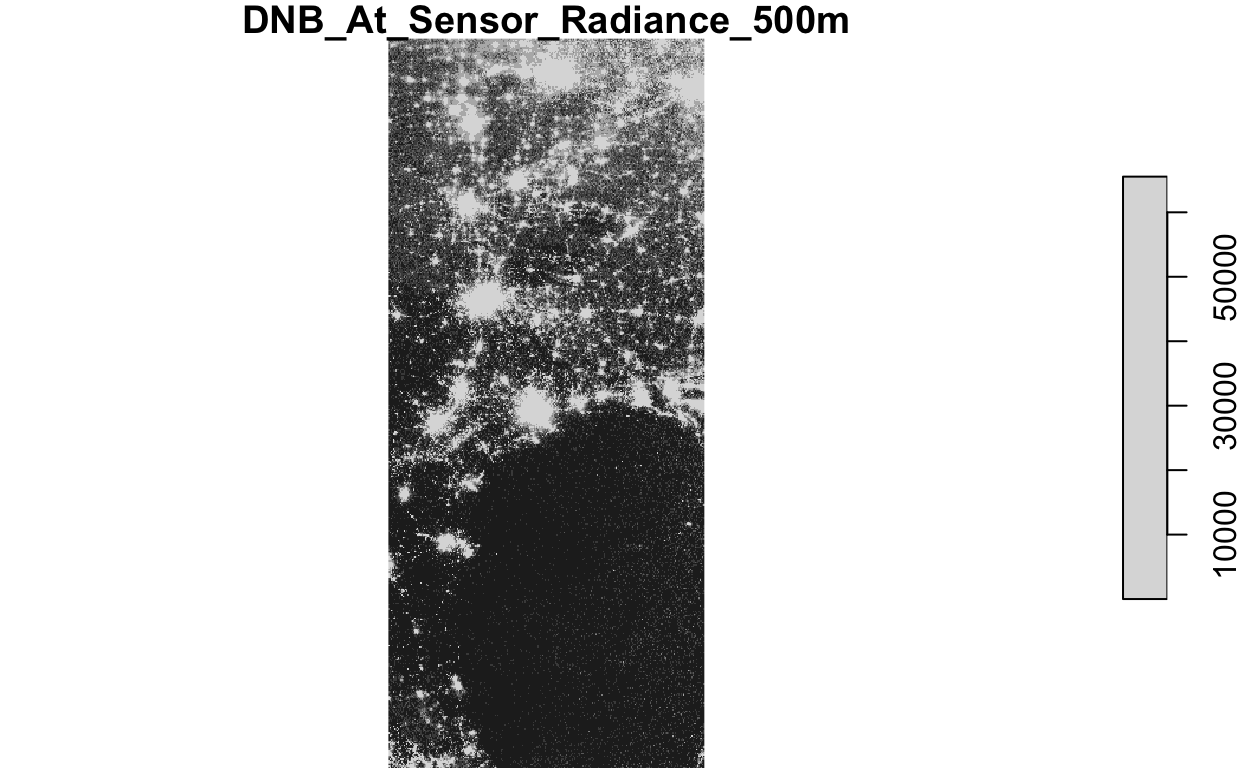
In my Spatial Analysis Class we calculated a rough estimate of the number of people who lost power from the 2021 Houston Ice Storm.
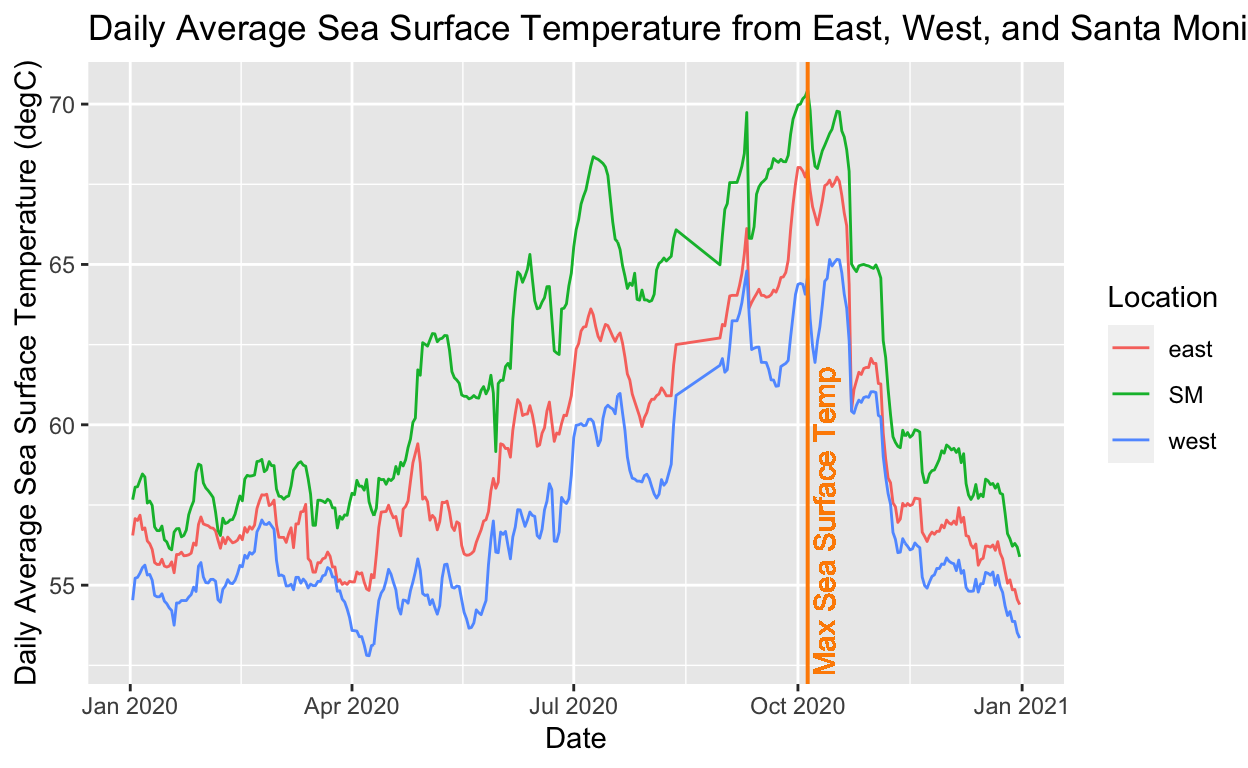
How does Wind Affect SST and Chlorophyll Levels in the Santa Barbara Channel?
In my meta-data and standards course we were task with combining multiple data sources to vizualize trends in our enviromental quesion. We then practiced maintaining and preserving our data on a data repository (https://knb.ecoinformatics.org/view/urn%3Auuid%3Ab9273004-1948-468a-93e7-d89a156bd172). The preserved data set contains daily means for sea surface temperature, wind, and chorophyll acquired through the Aqua MODIS sattelite and East, West, and Santa Monica NOAA Buoys.
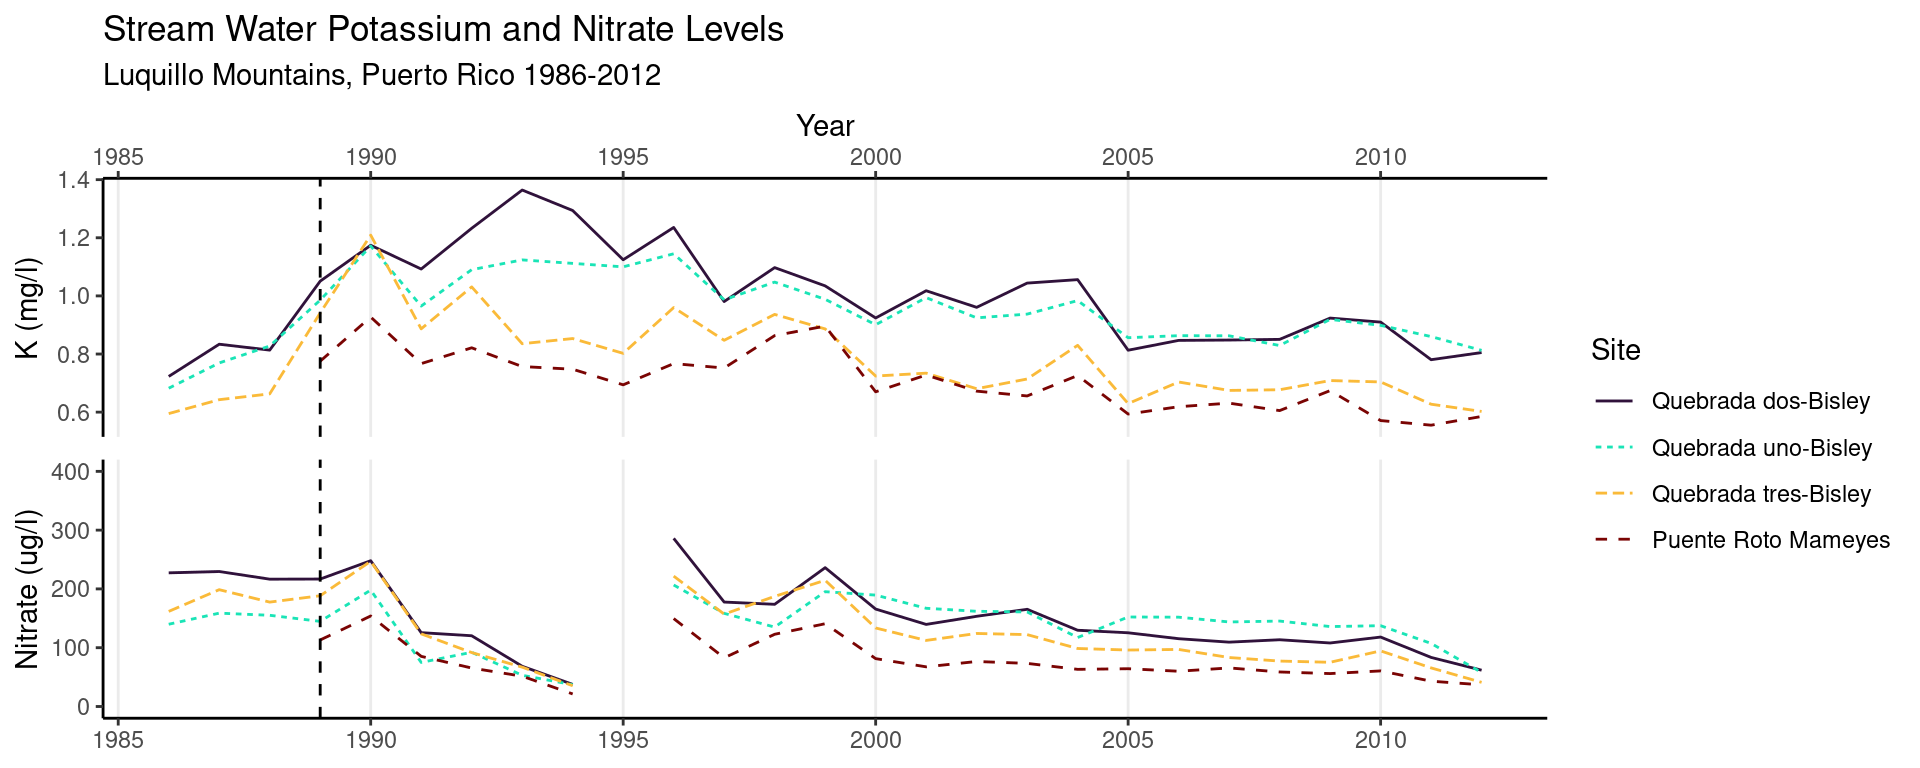
Hurricane Impacts on Stream Chemical Composition in the Luquillo Mountains, Puerto Rico
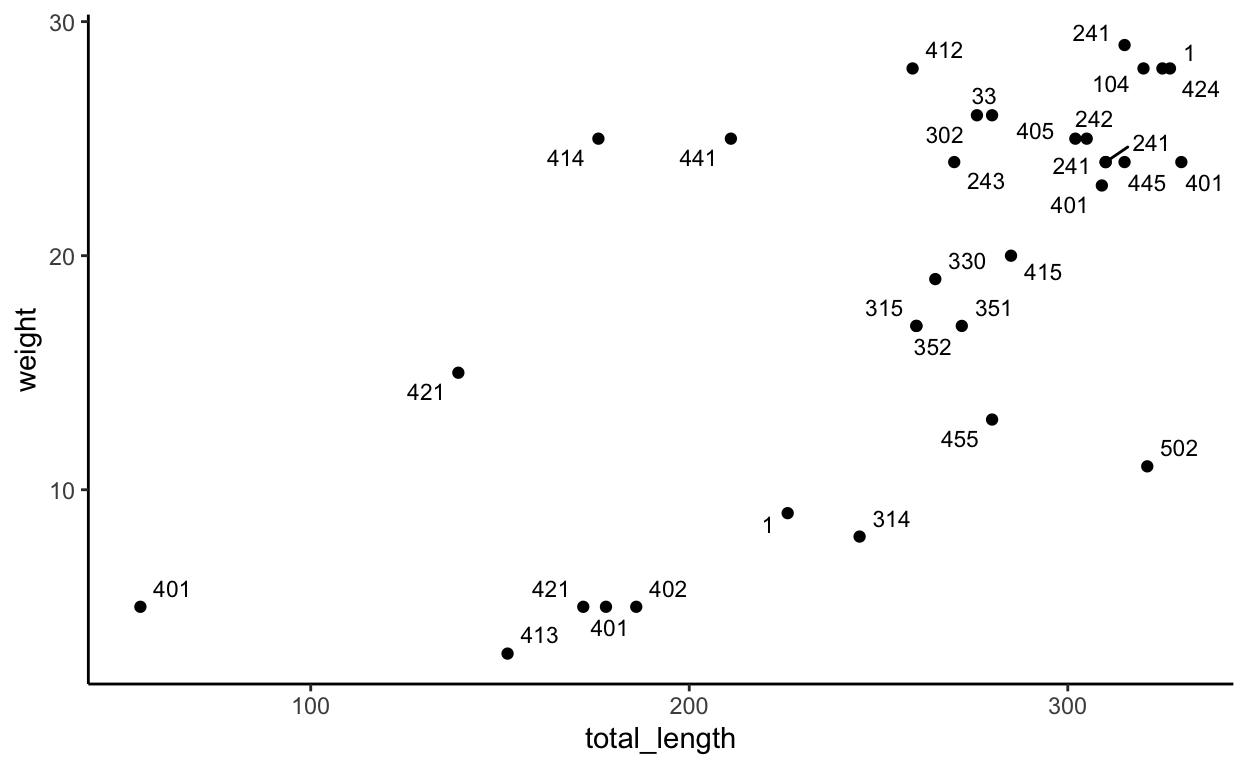
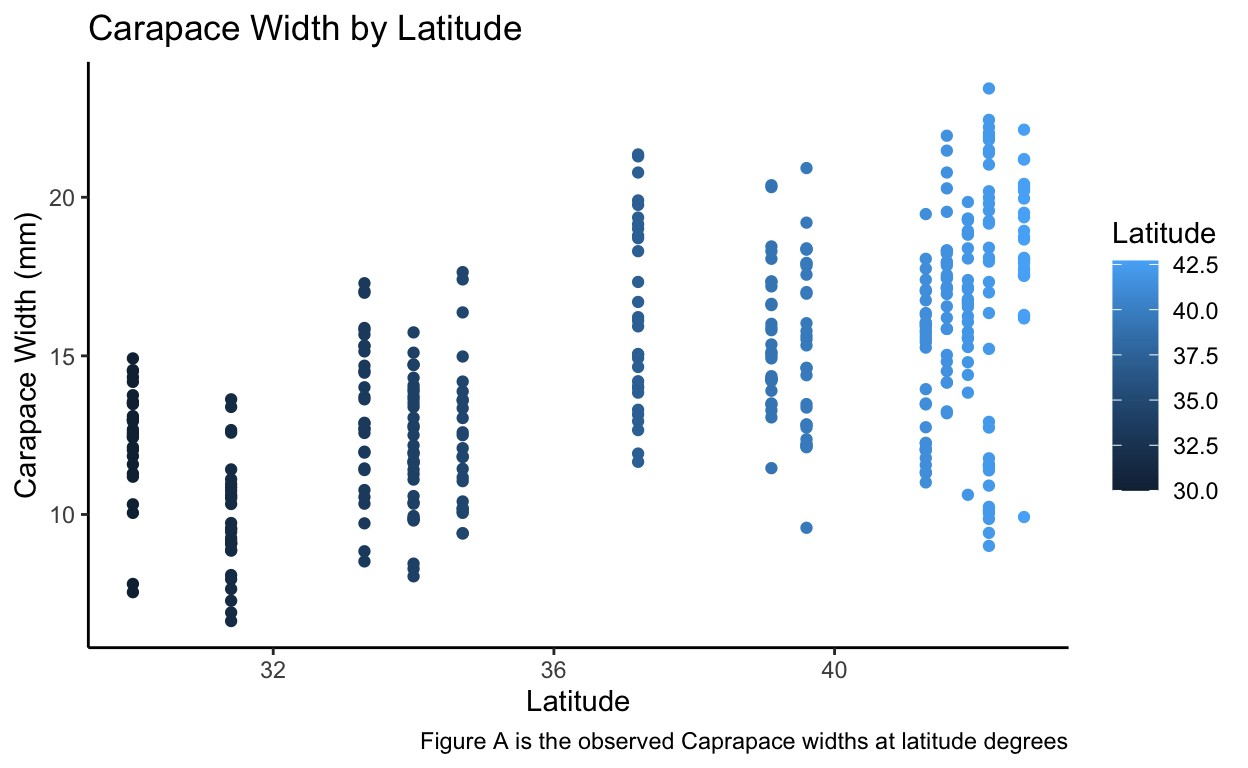
Figures
A handful of figures trying out different functions within ggplot.
Bringing it All Together
Some examples of using all my tools from EDS 221 to wrangle and create data visualizations.

Data Wrangling
Here are some new functions I learned which help quickly tabulate large data sets.