import numpy as np
import pandas as pd
import geopandas as gpd
import os
import shapely
import matplotlib.pyplot as plt
from shapely.geometry import Polygon
Read in data sets
fp = r"data/dma_admn_adm0_py_s1_dominode_v2.shp"
sightings = pd.read_csv('data/sightings2005_2018.csv')
ais = pd.read_csv('data/station1249.csv')
Define variables
projected_EPSG = 2002
geodetic_EPSG = 4326
meters_per_nm = 1852
cell_size = 2000
wide = 2000
length = 2000
Read in shape file
dr_shape = gpd.read_file(fp)

dr_shape['geometry'] = dr_shape['geometry'].to_crs(epsg = projected_EPSG)
Bootstrap whale sightings and fix time format
geometry = gpd.points_from_xy(sightings['Long'], sightings['Lat'], crs = geodetic_EPSG)
gdf = gpd.GeoDataFrame(sightings, geometry = geometry, crs = geodetic_EPSG)

gdf_time = pd.to_datetime(gdf['GPStime'])

gdf['TIMESTAMP'] = gdf_time

gdf['geometry'] = gdf['geometry'].to_crs(epsg = projected_EPSG)
Create initial data exploration/figure
fig, ax = plt.subplots(figsize=(5, 5))
ax.grid(True)
dr_shape.plot(ax = ax, color = "grey")
gdf.plot(ax = ax, color = "red", markersize = 1)
<AxesSubplot:>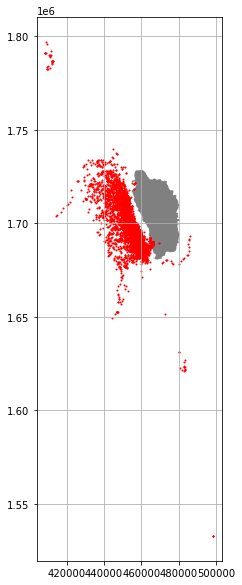
Create grid
xmin, ymin, xmax, ymax  = gdf.total_bounds

xs = list(np.arange(xmin, xmax + cell_size, cell_size))

ys = list(np.arange(ymin, ymax + cell_size, cell_size))
Loop for grid
def make_cell(x, y, cell_size):
    ring = [
        (x, y),
        (x + cell_size, y),
        (x + cell_size, y + cell_size),
        (x, y + cell_size)
    ]
    cell = shapely.geometry.Polygon(ring)
    return cell


cells = []
for x in xs:
    for y in ys:
        cell = make_cell(x, y, cell_size)
        cells.append(cell)
Create geodataframe
grid = gpd.GeoDataFrame({'geometry': cells}, crs=2002)

grid['geometry'] = grid['geometry'].to_crs(epsg = 2002)

grid.plot(facecolor = "none", figsize=(5, 5), linewidth = 1 )
<AxesSubplot:>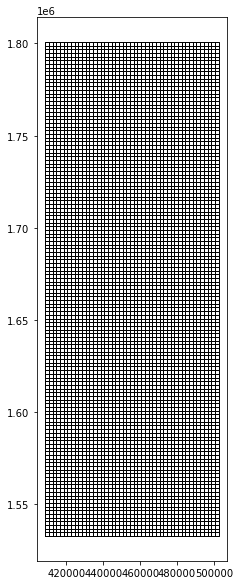
Join data frame with grid
gdf['geometry'] = gdf['geometry'].to_crs(epsg = projected_EPSG)
joined = grid.sjoin(gdf, how = 'inner')
Create unary convex hull of whale habitat
grid['count'] = joined.groupby(joined.index).count()['index_right']


grid_sub = grid[grid["count"] >20.0]

unary = grid_sub.geometry.unary_union

convex_hull = unary.convex_hull

zone = gpd.GeoDataFrame(geometry = gpd.GeoSeries(convex_hull), crs = projected_EPSG)

zone['geometry'] = zone['geometry'].to_crs(epsg = projected_EPSG)

whale_habitat_diff = zone.difference(dr_shape)

whale_habitat = gpd.GeoDataFrame(geometry = whale_habitat_diff)
Visualize whale habitat
fig, ax = plt.subplots(figsize=(10, 10))
ax.grid(True)
dr_shape.plot(ax = ax, color = "grey")
whale_habitat.plot(ax = ax, facecolor = "none", edgecolor = "red")
<AxesSubplot:>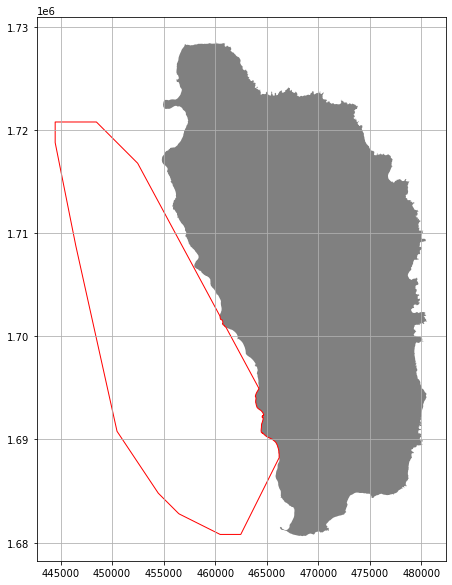
Set geometries
ais_geog = gpd.points_from_xy(ais['LON'], ais['LAT'], crs = geodetic_EPSG)

ais_geo = gpd.GeoDataFrame(ais, geometry = ais_geog)

ais_geo['geometry'] = ais_geo['geometry'].to_crs(epsg = projected_EPSG)
Fix time ais data set
ais_time = pd.to_datetime(ais_geo['TIMESTAMP'])

ais_geo['TIMESTAMP'] = ais_time
Locate whales within ROI
ais_whale = ais_geo.sjoin(whale_habitat, how = "inner")

ais_sorted = ais_whale.sort_values(['MMSI', 'TIMESTAMP'], ascending = True)

ais_shifted = ais_sorted.shift(periods = 1)
Combining rows in data tables
distance = ais_sorted['geometry'].distance(ais_shifted['geometry'])

ais_sorted['distance(m)'] = distance


TIMESTAMP_2 = ais_shifted['TIMESTAMP']

ais_sorted['TIMESTAMP_2'] = TIMESTAMP_2


MMSI_2 = ais_shifted['MMSI']

ais_sorted['MMSI_2'] = MMSI_2
Sort df
ais_sorted = ais_sorted[ais_sorted.MMSI == ais_sorted.MMSI_2]Calculate time
ais_sorted['delta_time(s)'] = ais_sorted['TIMESTAMP'] - ais_sorted['TIMESTAMP_2']

seconds = ais_sorted['delta_time(s)'] / np.timedelta64(1, 's')

ais_sorted['seconds'] = seconds
Calculate average speed
average_speed = ais_sorted['distance(m)'] / ais_sorted['seconds']

ais_sorted['average_speed(m/s)'] = average_speed
Calculate NM and seconds at 10 knots
ais_sorted['NM'] = ais_sorted['distance(m)']/meters_per_nm

ais_sorted['time@10knots'] = ais_sorted['NM'] / 10 * 60 * 60
Determine difference in time between reduced speed and recorded speeds
ais_sorted['difference_seconds'] = ais_sorted['time@10knots'] - ais_sorted['seconds']Remove positive values
dif_sec_great_zero = ais_sorted.loc[ais_sorted['difference_seconds']>0]28 days impact travel time for a 10 knot reduction
sum(dif_sec_great_zero['difference_seconds']/ 60/60/24)
27.87604044821323dif_sec_great_zero| Unnamed: 0 | MMSI | LON | LAT | TIMESTAMP | geometry | index_right | distance(m) | TIMESTAMP_2 | MMSI_2 | delta_time(s) | seconds | average_speed(m/s) | NM | time@10knots | difference_seconds | |
|---|---|---|---|---|---|---|---|---|---|---|---|---|---|---|---|---|
| 53218 | 53218 | 203106200 | -61.41927 | 15.34898 | 2015-04-26 16:08:16 | POINT (461363.603 1696280.393) | 0 | 1258.095562 | 2015-04-26 16:04:15 | 203106200.0 | 0 days 00:04:01 | 241.0 | 5.220314 | 0.679317 | 244.554213 | 3.554213 |
| 84957 | 84957 | 203518400 | -61.51546 | 15.41408 | 2015-04-14 17:35:26 | POINT (451023.962 1703455.061) | 0 | 2239.743578 | 2015-04-14 17:28:32 | 203518400.0 | 0 days 00:06:54 | 414.0 | 5.410009 | 1.209365 | 435.371322 | 21.371322 |
| 39279 | 39279 | 205531510 | -61.40981 | 15.35160 | 2015-05-02 18:26:15 | POINT (462378.106 1696572.914) | 0 | 675.968930 | 2015-05-02 18:24:17 | 205531510.0 | 0 days 00:01:58 | 118.0 | 5.728550 | 0.364994 | 131.397848 | 13.397848 |
| 139303 | 139303 | 205571000 | -61.50684 | 15.33412 | 2015-03-26 09:37:06 | POINT (451968.978 1694613.570) | 0 | 662.020878 | 2015-03-26 09:35:06 | 205571000.0 | 0 days 00:02:00 | 120.0 | 5.516841 | 0.357463 | 128.686564 | 8.686564 |
| 139301 | 139301 | 205571000 | -61.50115 | 15.33156 | 2015-03-26 09:39:06 | POINT (452580.343 1694331.833) | 0 | 673.159437 | 2015-03-26 09:37:06 | 205571000.0 | 0 days 00:02:00 | 120.0 | 5.609662 | 0.363477 | 130.851726 | 10.851726 |
| … | … | … | … | … | … | … | … | … | … | … | … | … | … | … | … | … |
| 450065 | 71530 | 775907000 | -61.41251 | 15.26938 | 2015-08-31 15:25:58 | POINT (462112.948 1687478.511) | 0 | 995.610920 | 2015-08-31 15:22:58 | 775907000.0 | 0 days 00:03:00 | 180.0 | 5.531172 | 0.537587 | 193.531280 | 13.531280 |
| 450061 | 71526 | 775907000 | -61.40833 | 15.27759 | 2015-08-31 15:28:58 | POINT (462559.266 1688387.759) | 0 | 1012.882607 | 2015-08-31 15:25:58 | 775907000.0 | 0 days 00:03:00 | 180.0 | 5.627126 | 0.546913 | 196.888628 | 16.888628 |
| 450059 | 71524 | 775907000 | -61.40408 | 15.28582 | 2015-08-31 15:31:59 | POINT (463013.057 1689299.250) | 0 | 1018.205189 | 2015-08-31 15:28:58 | 775907000.0 | 0 days 00:03:01 | 181.0 | 5.625443 | 0.549787 | 197.923255 | 16.923255 |
| 450056 | 71521 | 775907000 | -61.39967 | 15.29361 | 2015-08-31 15:34:59 | POINT (463484.122 1690162.135) | 0 | 983.093306 | 2015-08-31 15:31:59 | 775907000.0 | 0 days 00:03:00 | 180.0 | 5.461629 | 0.530828 | 191.098051 | 11.098051 |
| 172907 | 172907 | 982358863 | -61.40751 | 15.34122 | 2015-03-14 16:08:23 | POINT (462628.091 1695425.545) | 0 | 1086.815697 | 2015-03-14 16:04:52 | 982358863.0 | 0 days 00:03:31 | 211.0 | 5.150785 | 0.586834 | 211.260071 | 0.260071 |
21246 rows × 16 columns