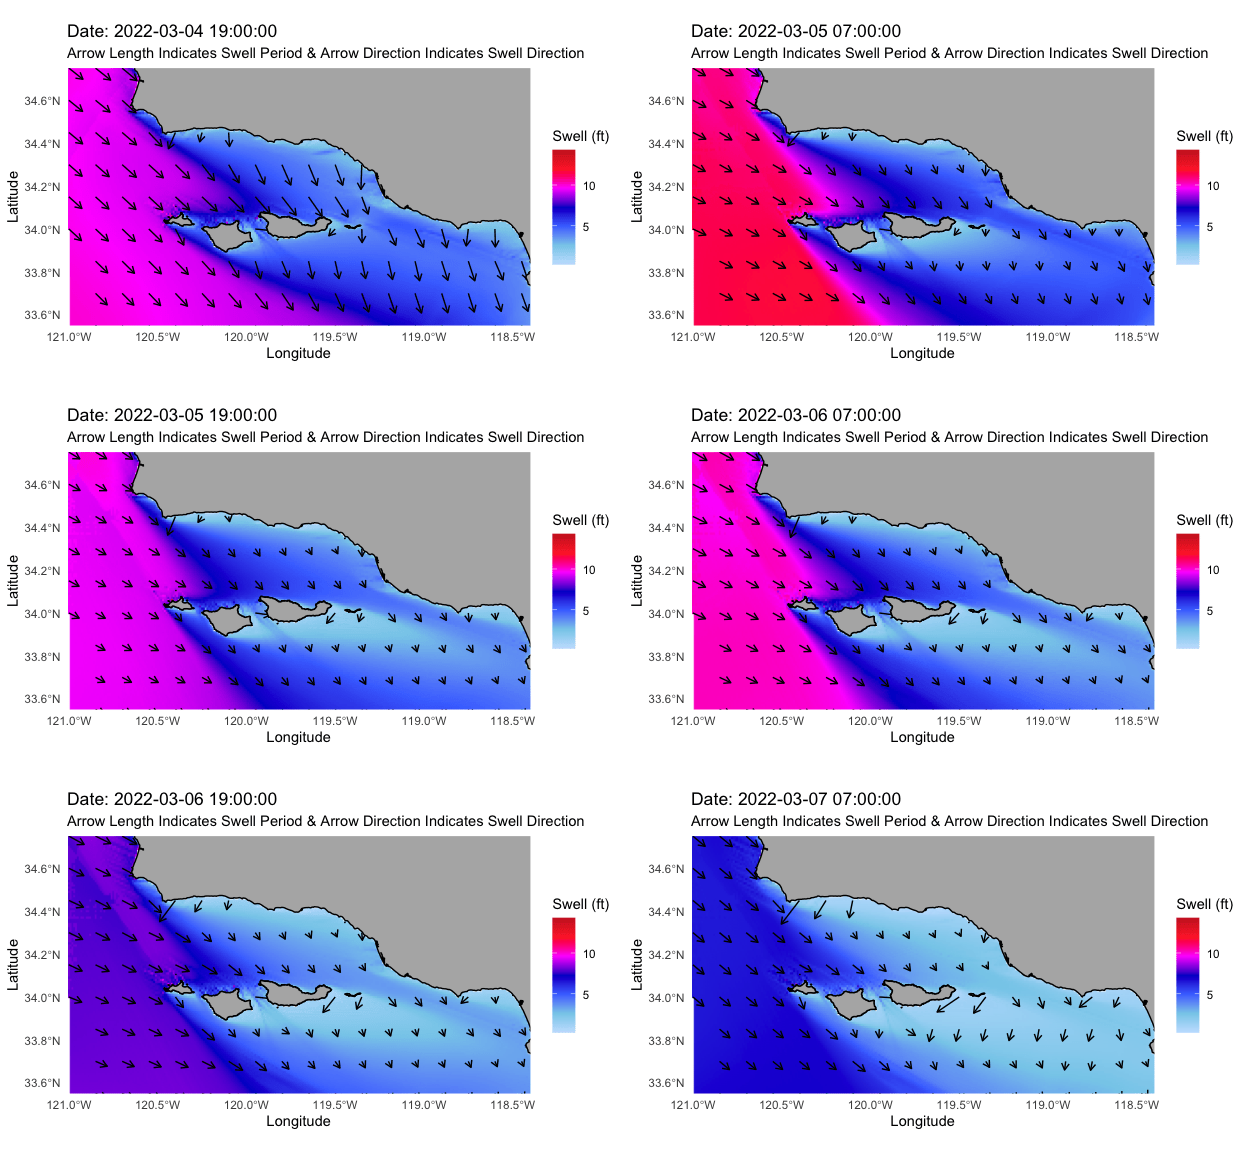
Read in and subset data for variable and ROI
date <- as.Date(Sys.time())


date <- as.Date(date) %>%
  paste0("T12:00:00Z")

past_date <- as.Date(date) +3

fut_date <- as.Date(past_date) %>%
  paste0("T12:00:00Z")

#height
url_Hs <- paste0("http://thredds.cdip.ucsd.edu/thredds/ncss/cdip/model/MOP_grids/CA_0.01_forecast.nc?var=waveHs&north=34.75&west=-121&east=-118.4&south=33.55&disableLLSubset=on&disableProjSubset=on&horizStride=1&time_start=", date, "&time_end=", fut_date, "&timeStride=1&addLatLon=true&accept=netcdf")


options(timeout = 10000)

Hs <- download.file(url_Hs, here("wave_data_Hs.nc"))

Hs <- here("wave_data_Hs.nc")

wave_Hs <-brick(Hs)

Hs_data <- as.data.frame(rasterToPoints(wave_Hs)) %>%
  pivot_longer(!c(x,y), names_to = "date", values_to = "height")


#Direction
url_Dp <- paste0("http://thredds.cdip.ucsd.edu/thredds/ncss/cdip/model/MOP_grids/CA_0.01_forecast.nc?var=waveDp&north=34.75&west=-121&east=-118.4&south=33.55&disableLLSubset=on&disableProjSubset=on&horizStride=1&time_start=", date, "&time_end=", fut_date, "&timeStride=1&addLatLon=true&accept=netcdf")


options(timeout = 10000)

Dp <- download.file(url_Dp, here("wave_data_Dp.nc"))

Dp <- here("wave_data_Dp.nc")

wave_Dp <-brick(Dp)

Dp_data <- as.data.frame(rasterToPoints(wave_Dp)) %>%
  pivot_longer(!c(x,y), names_to = "date", values_to = "direction")

#period
url_Ta <- paste0("http://thredds.cdip.ucsd.edu/thredds/ncss/cdip/model/MOP_grids/CA_0.01_forecast.nc?var=waveTa&north=34.75&west=-121&east=-118.4&south=33.55&disableLLSubset=on&disableProjSubset=on&horizStride=1&time_start=", date, "&time_end=", fut_date, "&timeStride=1&addLatLon=true&accept=netcdf")


options(timeout = 10000)

Ta <- download.file(url_Ta, here("wave_data_Ta.nc"))

Ta <- here("wave_data_Ta.nc")

wave_Ta <-brick(Ta)

Ta_data <- as.data.frame(rasterToPoints(wave_Ta)) %>%
  pivot_longer(!c(x,y), names_to = "date", values_to = "period")
clean data
un_data <- left_join(Hs_data, Dp_data)

full_data <- left_join(un_data, Ta_data) %>%
  mutate(date = gsub("X", "", date)) %>%
  mutate(date = as.numeric(date))

clean_data <- full_data %>%
  mutate(date = as_datetime(date)) %>%
  mutate(height = 3.28 * height) %>%
  mutate(angle = ((3.14/180)*(direction) + 0.5))
Shape Files
islands <- read_sf(here("_posts", "2021-11-10-cdip-bouy-forecast", "shape", "channel_islands.shp")) %>%
  mutate(geometry = st_transform(geometry, crs = 4326)) %>%
  filter(!NAME %in% c("Santa Catalina", "San Clemente", "Santa Barbara", "San Nicolas"))

ca <- read_sf(here("_posts", "2021-11-10-cdip-bouy-forecast", "s_11au16", "s_11au16.shp")) %>%
  mutate(geometry = st_transform(geometry, crs = 4326)) %>%
  filter(NAME == "California") %>%
  select(geometry)

merged_shapes <- bind_rows(ca, islands)
GGAnimate
wind.arrows <- clean_data %>%
    filter(x %in% sort(unique(x))[c(T, F, F, F, F, F, F, F,
                                    F, F, F, F, F, F, F)],
           y %in% sort(unique(y))[c(T, F, F, F, F, F, F, F,
                                    F, F, F, F, F, F, F)])

a <- ggplot(data = clean_data) +
  geom_raster(aes(y=y, x=x,
                  fill = height, frame = date), interpolate = T) +
  geom_spoke(data = wind.arrows, aes(y=y, x=x, angle = angle, radius = scales::rescale(period, c(.02, .15))),
             arrow=arrow(length = unit(0.2,"cm"))) +
  scale_fill_gradientn(colours = c("slategray1","skyblue",
                                   "royalblue1", "mediumblue",
                                   "magenta1", "firebrick1", "firebrick3")) +
  transition_states(date) +
  labs(title = 'Date: {closest_state}', fill = "Swell (ft)",
       subtitle =
        'Arrow Length Indicates Swell Period & Arrow Direction Indicates Swell Direction') +
  theme_classic() +
  xlab("Longitude") +
  ylab("Latitude") +
  geom_sf(data = merged_shapes, color = "black", fill = "grey70") +
  coord_sf(xlim = c(-121.01, -118.4), ylim = c(33.55, 34.75), expand = F) +
  theme(axis.line=element_blank(),
        axis.ticks=element_blank(),
        panel.background=element_blank(),
        panel.border=element_blank(),
        panel.grid.major=element_blank(),
        panel.grid.minor=element_blank(),
        plot.background=element_blank())

animate(a, nframes = 40, fps = 5)
